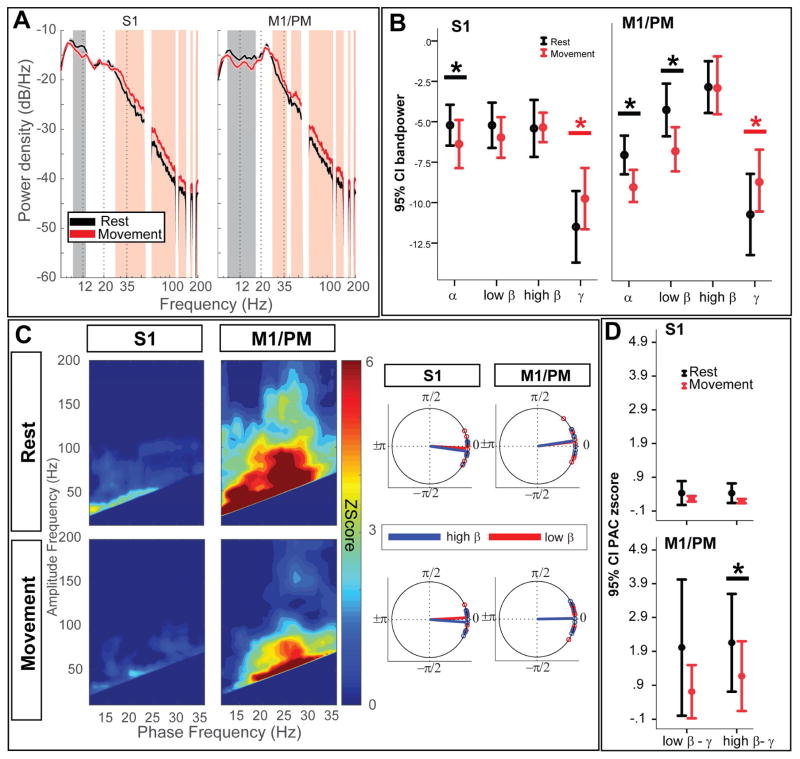
Figure 3.
Movement changes cortical power in low β and cortical PAC in high β frequencies (A) Group average PSDs are plotted for S1 (left) and M1/PM (right), in the DBS-OFF condition, during rest (black trace) and contralateral hand movement (red trace). Vertical shade represents statistically significant difference observed by two-group test of spectrum. Frequency axis is plotted in log format to magnify changes in β band. (B) Average band power values are also compared between rest (black) and contralateral hand movement (red). Asterisk (*) sign indicates statistically significant difference (P<0.05, tested by non-parametric Wilcoxon signed-rank test, corrected for multiple comparisons using Bonferroni). Each bar shows the mean (across the cohort) and 95% confidence interval of the mean. (C) On the left hand side, average z-score maps for the cohort are represented, during DBS-OFF recordings for rest (top row) and contralateral hand movement (bottom row). On the right hand side, average preferred phase of coupling for low β-broadband γ (red) and high β-broad band γ (blue) are represented. (D) Comparing average PAC between rest and movement indicates statistically significant suppression of high β-broadband γ PAC at M1/PM. Asterisk (*) indicates statistical significance at P<0.05 (Wilcoxon signed rank test, Bonferroni correction). Each bar shows the mean (across the cohort) and 95% confidence interval of the mean.

