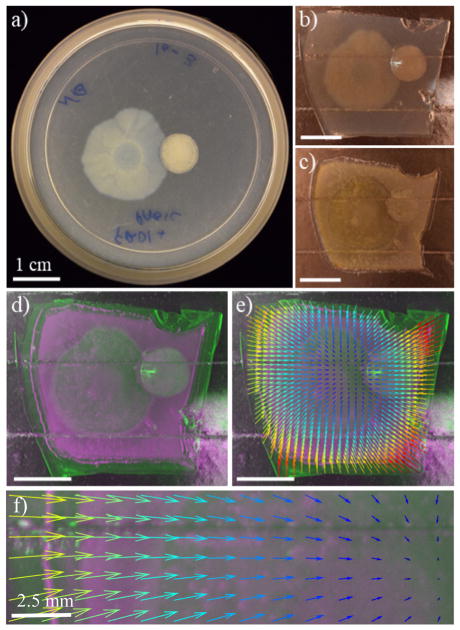
Figure 1.
Evaluation of biofilm dehydration in preparation for SIMS imaging. A 72 h P. aeruginosa PAO1C (left) and FRD1 (right) co-culture: (a) as cultivated in a Petri dish; (b) excised and transferred to a SIMS sample plate with double-sided copper tape; (c) after dehydration with N2; (d) overlay of the same sample before (green) and after (purple) dehydration; (e) quiver plot with vector length and color showing the magnitude and direction of dehydration- induced contraction; and (f) inset of the quiver plot shown in e. The scale bars represent 1 cm in a–d and 2.5 cm in f.

