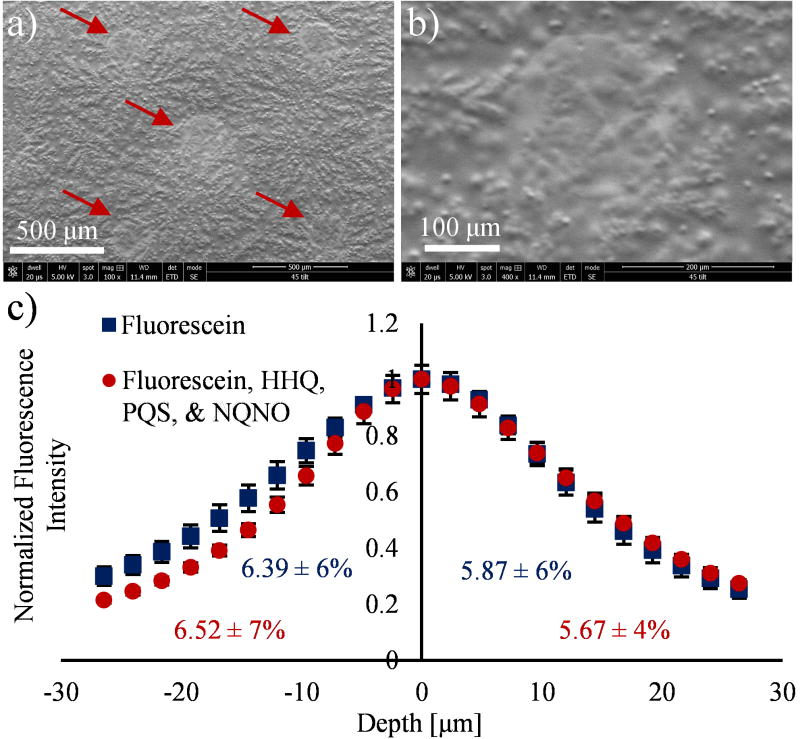
Figure 2.
SEM and three-dimensional confocal fluorescence microscopy evaluation of standards deposited onto dehydrated agar via chemical inkjet printing. (a) Electron micrograph of five 1 nL depositions (as indicated by red arrows) containing 100 μM each of HHQ, PQS, and NQNO. (b) Higher magnification micrograph of a single standard spot from a. (c) Average fluorescence intensity depth profile for fluorescein in four spots containing either 20 μM fluorescein (blue squares) or 20 μM fluorescein and 100 μM each of HHQ, PQS, and NQNO (red circles). The integrated fluorescence intensity in the space below and above the agar surface is provided in blue and red text for the two deposition conditions. Shown are 23 Z-stacks from −26.4 μm below the surface to 26.4 μm above the surface. The scale bars in a and b represent 500 μm and 100 μm respectively, and the error bars in c represent standard deviation.

