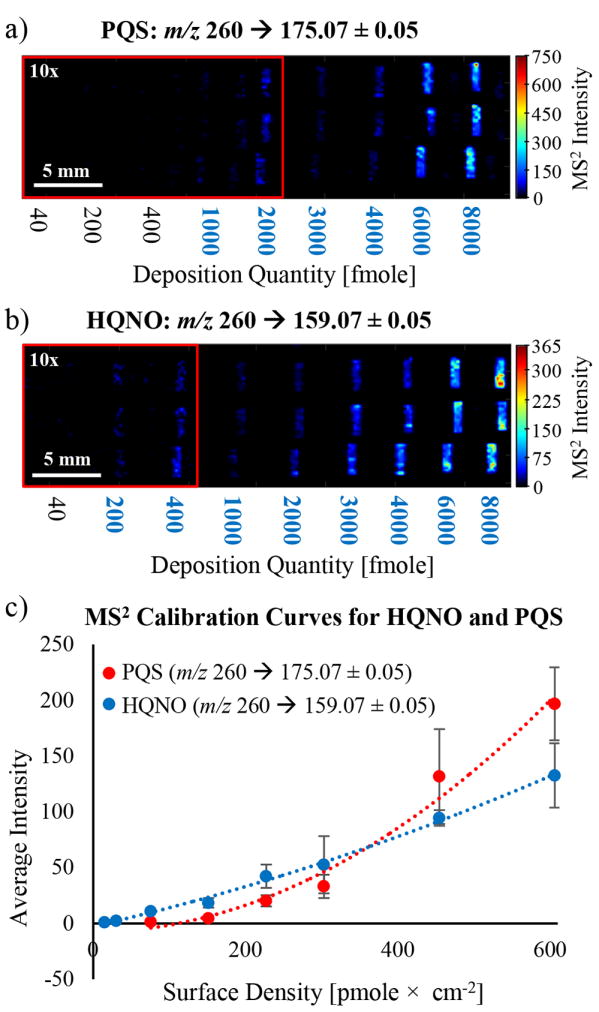
Figure 3.

SIMS product ion quadratic calibration images, curves, and regression data: calibration images for (a) PQS (m/z 260 → 175.07) and (b) HQNO (m/z 260 → 159.07) printed on dry agar; and (c) calibration curves for PQS and HQNO. The color scale was magnified by a factor of 10 in the red boxes in a and b to illuminate the lower deposition quantities, and the blue quantities in the image indicate the quantitation range used. Additional calibration information, including calibration curves for C9-PQS and NQNO, can be found in Figures S3 and S4.
