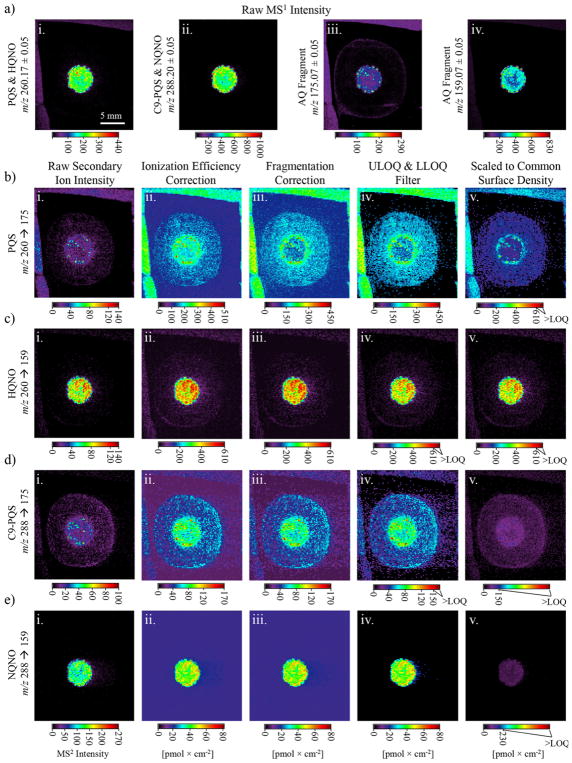
Figure 4.
SIMS imaging of a 72 h P. aeruginosa PAO1C colony biofilm. (a) Raw SIMS MS1 images for (a (i)) PQS and HQNO, (a (ii)) C9-PQS and NQNO, and AQ fragments (a (iii)) m/z 175.07 and (a (iv)) 159.07; (b–e) MS2 quantitative image progressions for (b) PQS, (c) HQNO, (d) C9-PQS, and (e) NQNO. Images in column b–e (i) show the uncorrected (raw) secondary ion intensity. Images in column b–e (ii) are corrected for ionization efficiency; column b–e (iii) are corrected for common (interfering) product ions; column b–e (iv) show the ULOQ and LLOQ corrections; and column b–e (v) are scaled to a common maximum surface density of 610 pmol × cm−2 to facilitate direct and quantitative analyte-to-analyte distribution comparisons. High intensity regions outside of the agar shown in a–d arose from the chemical background of the copper tape.

