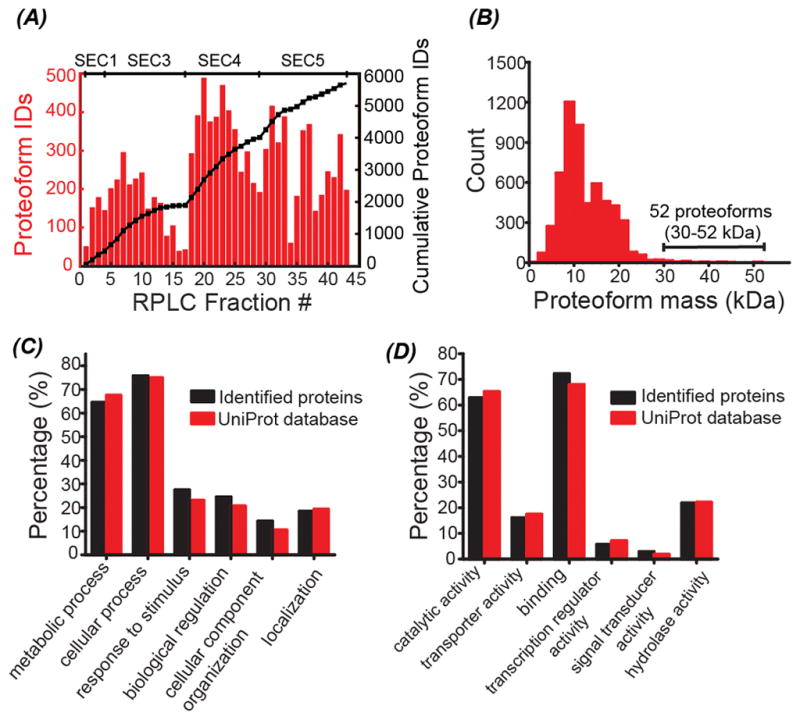
Figure 2.

Summary of the identified proteins and proteoforms. (A) The number of proteoform IDs in each RPLC fraction (the red colored bars); the cumulative proteoform IDs vs. the number of RPLC fractions (the black line with squares). The SEC fraction to which the RPLC fractions belong was labelled on the top of the figure. (B) Distribution of the mass of the identified proteoforms. (C) Distribution of the biological process of identified proteins in this work and the proteins in the UniProt E. coli database. (D) Distribution of the molecular function of identified proteins in this work and the proteins in the UniProt E.coli database. The “Retrieve/ID mapping” tool in the UniProt website was used to obtain the gene ontology (GO) information of proteins.
