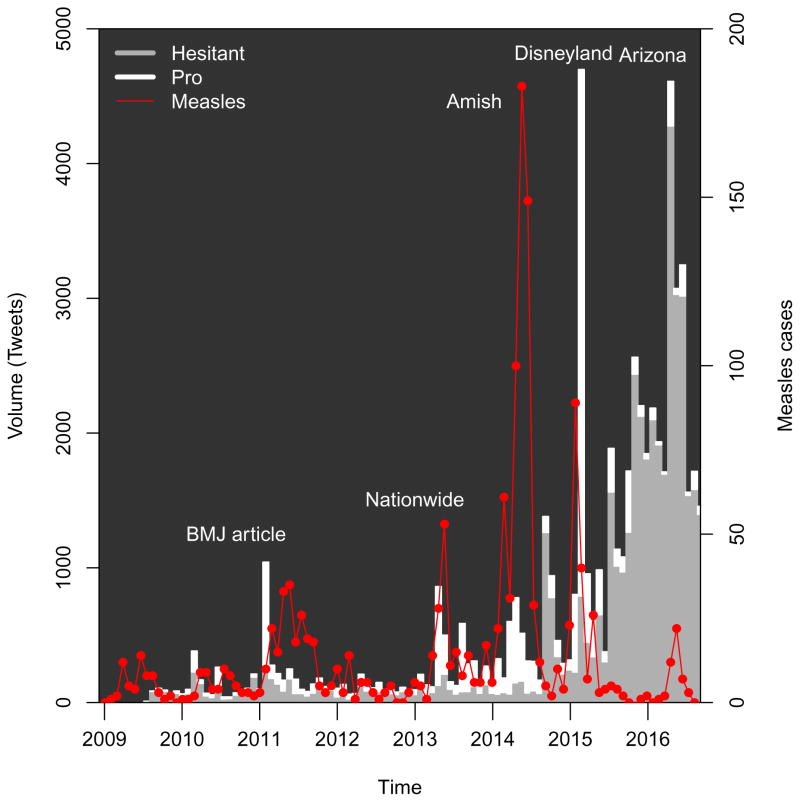
Figure 2.
Tweet volume matching query, by stance , 2009–2016, according to classification by BrightView, as described in the text. Measles cases are shown by the differenced cumulative series derived from CDC reports, as described in the text. Tweet volume and reported measles cases shown in consecutive periods of four weeks, with a final period consisting of 3 weeks. Additional details on the measles outbreaks are given in the Appendix. Source: Crimson Hexagon, CDC.

