
Fig. 1.
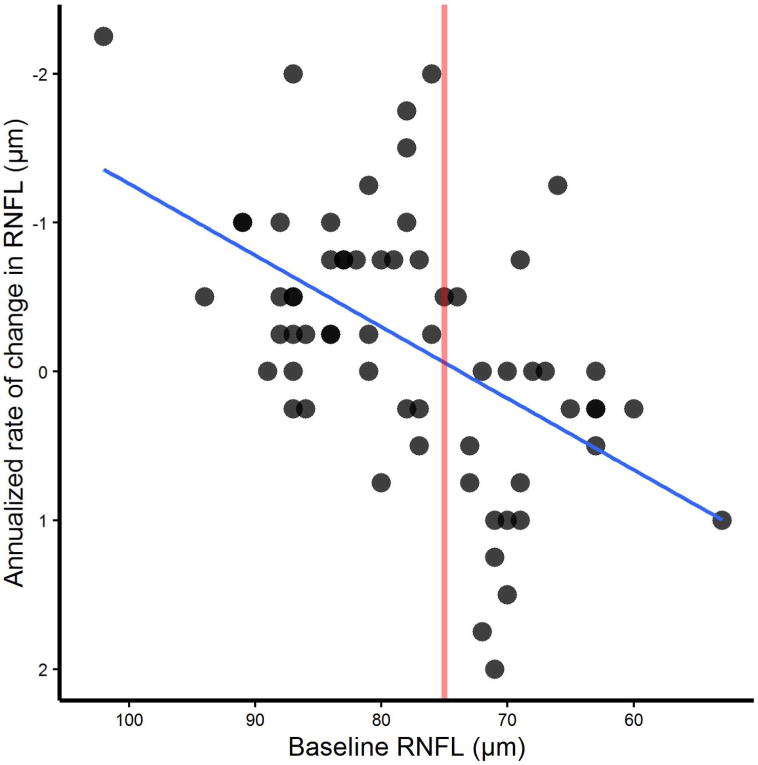
RNFL baseline thickness affects longitudinal RNFL atrophy rate. Baseline mean RNFL SD-OCT value was plotted against amplitude of change in RNFL thickness at two years. The scatterplot shows a linear relationship of starting RNFL thickness to annualized rate of change in μm. Larger mean RNFL thicknesses at baseline showed greater annualized rates of atrophy. Slope =−0.097 (p<0.001), covariate corrected mixed model to account for repeated measures. The solid line shows that at 75 μm, the change appears to go from a net negative to net positive value on average.