
Figure 3.
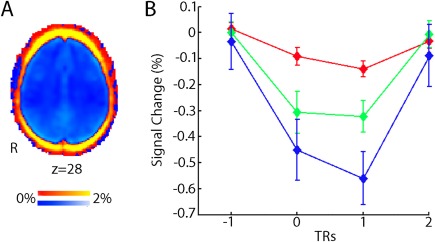
Spatial distribution and time course of motion artifacts. (A) Motion reduces BOLD signal (blue, negative % signal change) throughout the brain parenchyma, but increases signal around the rim of brain (red, positive percent signal change). (B) Motion produces a large reduction in global BOLD signal that is maximal in the volume following subject movement. The magnitude of signal reduction increases as motion amplitude increases (red, >0.3 mm displacements; green, >0.5 mm, blue >0.7 mm). Results are from a fixed impulse response analysis of the global signal time series. Reprinted with permission from Satterthwaite et al. [2013].