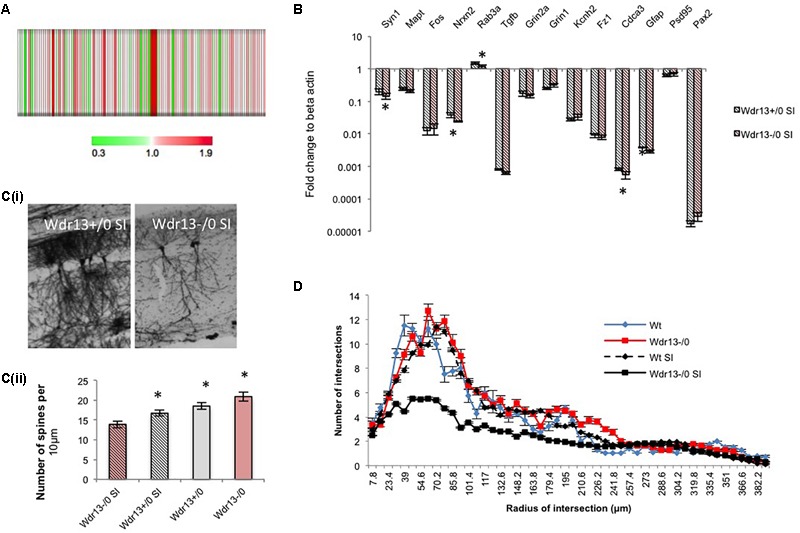
FIGURE 4.

Expression analysis of synaptic genes and histological examination of hippocampus in Wdr13-/0 mice after 3 weeks social isolation. (A) Heat map of quantified proteins from hippocampus of socially isolated Wdr13-/0 mice using iTRAQ based proteomics. (B) Transcript levels of synaptic genes like Nrxn2, Rab3a, Syn1 showed decrease in the Wdr13-/0 hippocampus (t-test; p < 0.05) than the wild-type (n = 5). (C) (i) Representative images showing CA1 neurons in wild-type and Wdr13-/0 mice after social isolation. (ii) Spine density of CA1 neurons in different groups (individual t-test; p < 0.05). (D) The dendritic branching of hippocampal CA1 neurons in Wdr13-/0 mice was significantly lesser (Two-way ANOVA, F(1,3900) = 8806; p < 0.005) than the wild-type mice after social isolation. Wdr13+/0, wild-type; Wdr13-/0, Wdr13 knockout mice; SI, Social Isolation. ∗ denotes p < 0.05 and ∗∗ denotes p < 0.005.
