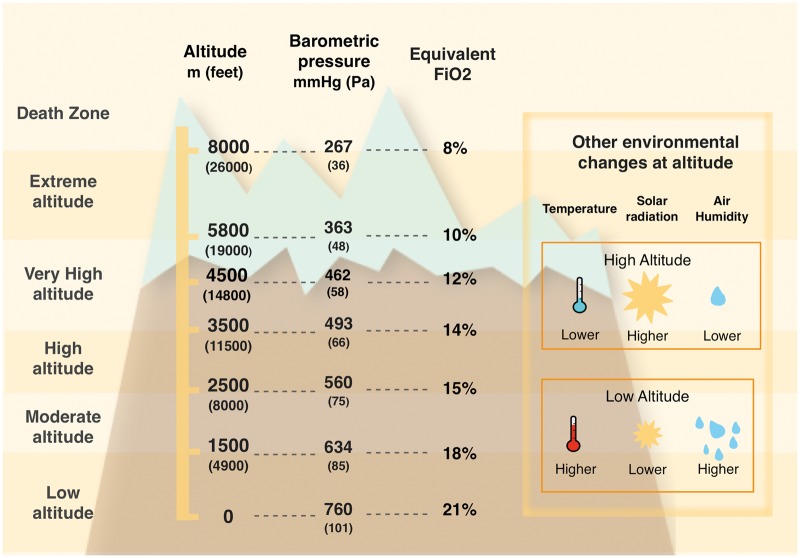
Figure 1.
Altitude classification (Imray et al.1S) (left column); corresponding barometric pressure and fraction in inspired oxygen for different simulated altitudes in a laboratory setting, according to the 1976 US standard Atmosphere by NASA.5S (central two columns); relationship between altitude2S and environmental characteristics (temperature, humidity, and solar radiation) (box on the right-hand side). We used the 1976 US standard atmosphere model by NASA to estimate barometric pressure at a given altitude, because the former is a function not only of altitude but also of latitude. For similar altitudes, barometric pressure (and consequently also partial pressure of arterial oxygen) is higher the closer we are to the equator line.

