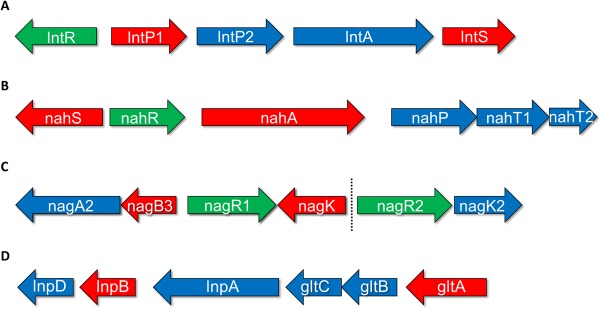
FIG 1.
Schematic representation of HMO metabolism-associated loci in B. breve UCC2003, as identified previously (21). (A) The genes of the lnt locus; (B) the genes of the nah locus; (C) the genes of the nag locus and the adjacent genes nagR2 and nagK2; (D) the genes of the lnp-glt locus. The length of the arrows is proportional to the size of the open reading frame. Genes shown in red possess a predicted promoter in their upstream intergenic region. Genes shown in green are predicted to encode a regulator protein. Genes shown in blue were identified as not possessing a predicted promoter in their upstream intergenic region.

