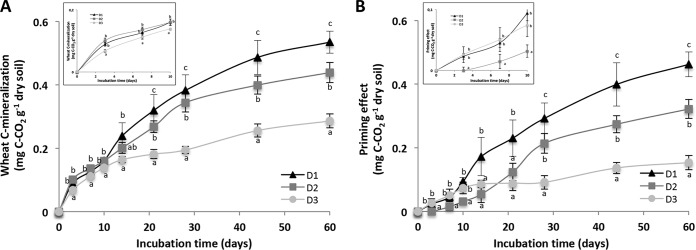
FIG 4.
Cumulative respiration of wheat residues (A) and cumulative priming effect (B) were measured during 60 days of incubation for the three levels of diversity: D1, high diversity; D2, medium diversity; D3, low diversity. For each incubation time and level of diversity, values with different letters differ significantly (P < 0.05). Insets represent a focus on the first 10 days to visualize the early shifts. Error bars denote standard deviations of biological replicates (n = 3).

