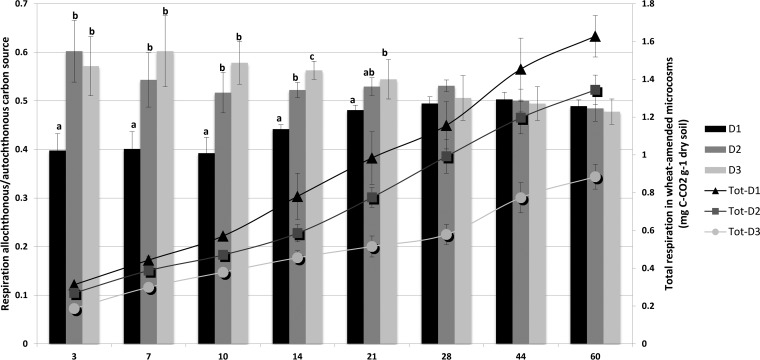
FIG 5.
Relative contribution of allochthonous versus autochthonous carbon sources to total CO2 emission (bars) and cumulative total soil respiration in wheat-amended microcosms (curves) during 60 days of incubation for the three levels of diversity (D1, high; D2, medium; D3, low). For each incubation time and level of diversity, values with different letters differ significantly (P < 0.05). Error bars denote standard deviations of biological replicates (n = 3).

