
FIG 2.
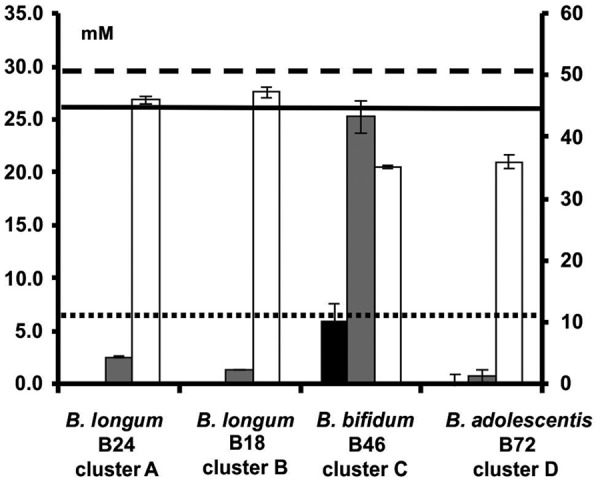
Residual concentrations of fructose (white bars; right axis), arabinose (gray bars; left axis), and xylose (black bars; left axis) after 24 h or 48 h of fermentation with bifidobacterial strains representing clusters A to D, in MCB supplemented with 9.0 g liter−1 (51.7 mM) of fructose or 1.0 g liter−1 (6.7 mM) of arabinose and 4.0 g liter−1 (26.6 mM) of xylose. The horizontal lines represent the initial concentrations of fructose (dashed line), arabinose (dotted line), and xylose (solid line).