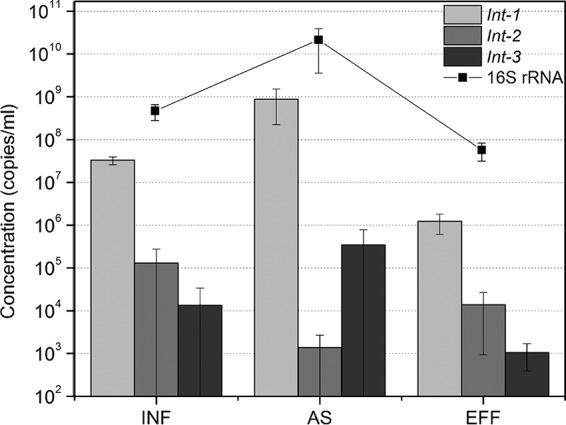
FIG 1.

Variation in concentrations of integrons (class 1, class 2, and class 3) during wastewater treatment. The line shows the variable concentrations of the total bacterial community through wastewater treatment. INF, influent; AS, activated sludge; EFF, effluent. Means ± SDs are shown.
