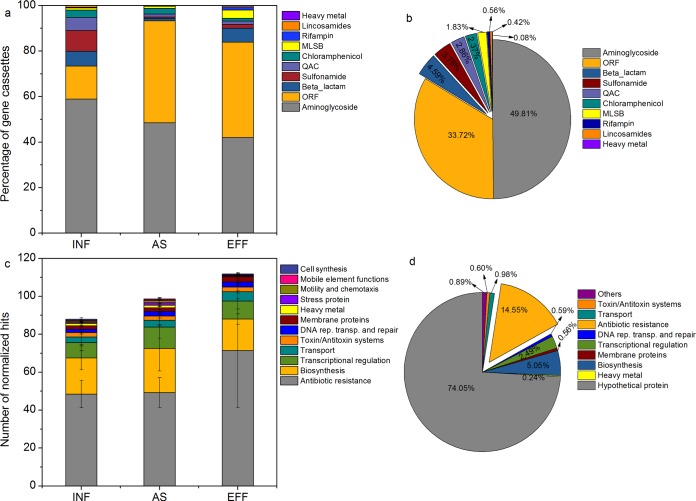
FIG 4.
Percentage of class 1 integron-associated gene cassettes during wastewater treatment based on a clone library (a and b) and high-throughput sequencing data (c and d). The bar chart shows the variation in abundance of gene cassettes during wastewater treatment, and the pie chart reveals the percentage of all gene cassettes from 18 WWTP samples. The number of normalized hits was calculated by normalization to the average number of total reads for each sample. MLSB, macrolide-lincosamide-streptogramin B; QAC, quaternary ammonium compound; ORF, open reading frame; DNA rep. transp. and repair, DNA replication, transport, and repair. Means ± SD are shown.

