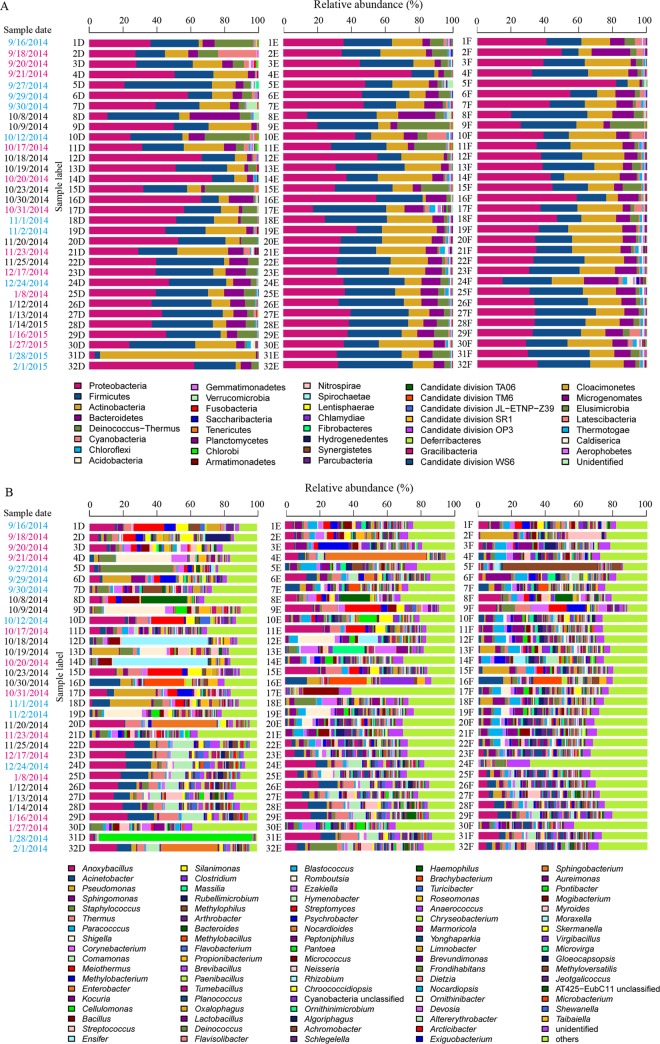
FIG 1.
Dominant bacterial groups identified at the phylum level (A) and at the genus level (B). Blue text, pink text, and black text for the sample dates refer to non-, light-, and heavy-haze sample days, respectively. D, E, and F represent PM2.5, PM10, and TSP, respectively. The category “others” includes all genera for which relative abundances are lower than 2%.

