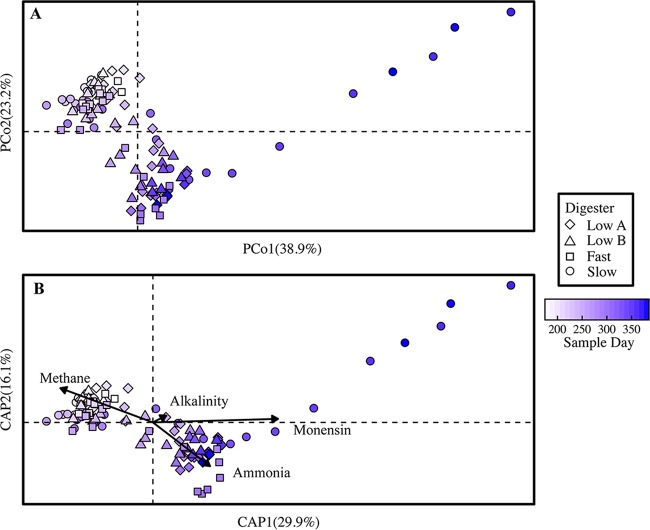
FIG 1.
β-Diversity of all anaerobic digester microbiome samples from day 175 to the end of the operating period. (A) Principal-coordinate analysis (PCoA) plot based on weighted UniFrac distance. (B) Distance-based redundancy analysis (db-RDA) plot showing the four measured parameters that best explained the variation observed in the PCoA plot. Methane, methane yield; alkalinity, bicarbonate alkalinity concentration; ammonia, total ammonium concentration; monensin, monensin concentration in the substrate. In both the PCoA and db-RDA plots, the points are colored on a gradient scale representing the duration of the operating period in days.

