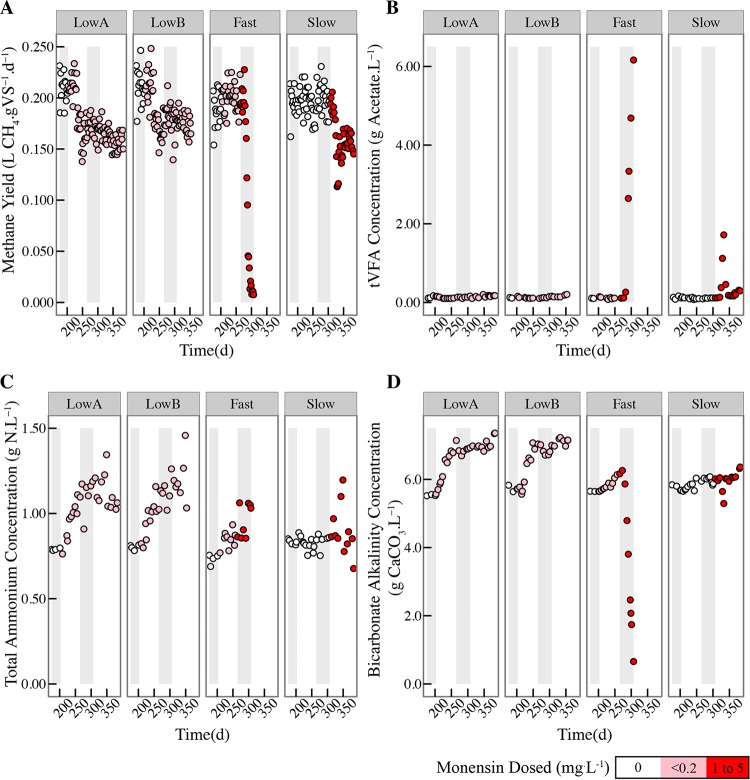
FIG 2.
Performance parameters for the four anaerobic digesters from day 175 to the end of the operating period for specific methane yields (A), tVFA concentrations (B), total ammonium concentrations (C), and bicarbonate alkalinity concentrations (D). Points are colored on a color scale corresponding to the concentration of monensin dosed to the anaerobic digester at that time point. The different periods are marked with gray and white shading from left to right during the operating period: the first gray shading identifies P1; the first white shading identifies P2; the second gray bar identifies P3, and the second white area identifies P4 (see Table S4 in the supplemental material). The fast anaerobic digester was stopped at the end of P3 due to a loss of stability.

