FIG 3.
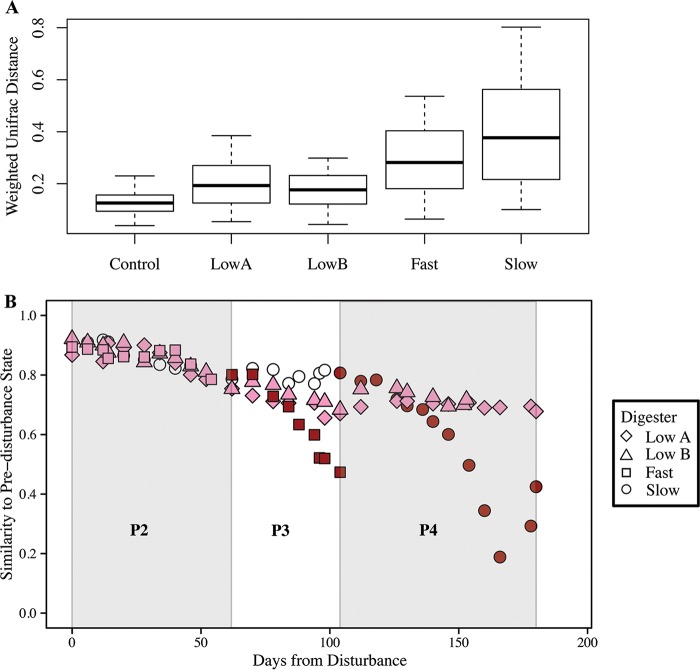
β-Diversity of anaerobic digester microbiome samples during different periods. (A) Boxplot of weighted UniFrac distances within microbiomes from a single anaerobic digester throughout a similar operating period. Control anaerobic digester boxplot corresponds to days 203 to 306, when the slow anaerobic digester was fed only control cow manure without monensin addition; the low A anaerobic digester boxplot corresponds to days 203 to 383; the low B anaerobic digester boxplot corresponds to days 203 to 355; the fast anaerobic digester boxplot only includes samples during which the anaerobic digester was subjected to high concentrations of monensin (i.e., days 265 to 306); and the slow anaerobic digester boxplot corresponds to days 306 to 383, when the anaerobic digester was subjected to high concentrations of monensin. (B) Similarity of samples postdisturbance compared to three samples prior to disturbance (prior to P2 on days 175, 189, and 201) based on the weighted UniFrac distance metric. Similarity was calculated as one minus the average weighted UniFrac distance between the sample day and the three sample days prior to disturbance (prior to P2). Colors represent the monensin concentration gradient: dark red, high monensin concentration (1 to 5 mg · liter−1); pink, low monensin concentration (<1 mg · liter−1); white, no monensin in substrate. Periods (P2 to P4) are represented by gray and white shading.

