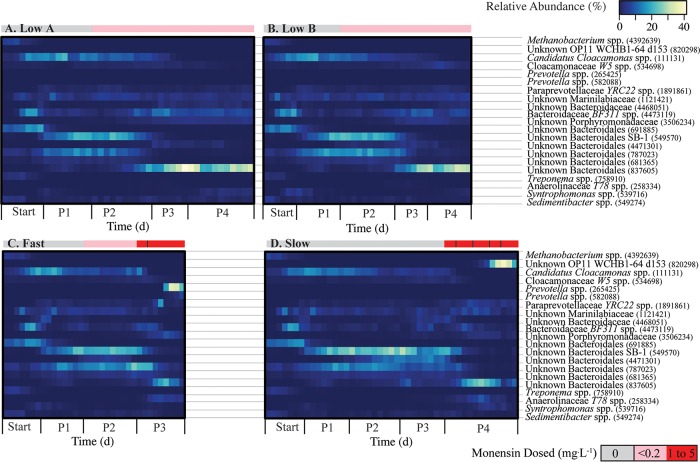
FIG 4.
Heatmaps representing relative abundance of major OTUs in anaerobic digester samples during the entire sampling period for the low A anaerobic digester (A), low B anaerobic digester (B), fast anaerobic digester (C), and slow anaerobic digester (D). OTUs represented here reached at least 5% relative abundance in any one anaerobic digester sample. Lowest-level taxonomic data, as well as the OTU ID number, are provided. The sidebar color scale represents the monensin dosing rate to the anaerobic digester. For the fast digester (panel C), the black line in the red bar indicates when the monensin dose was directly increased from 1 to 5 mg · liter−1. For the slow digester (panel D), the black lines in the red bar indicate when the monensin dose was increased (from 1 to 2 mg · liter−1, from 2 to 3 mg · liter−1, from 3 to 4 mg · liter−1, and from 4 to 5 mg · liter−1).

