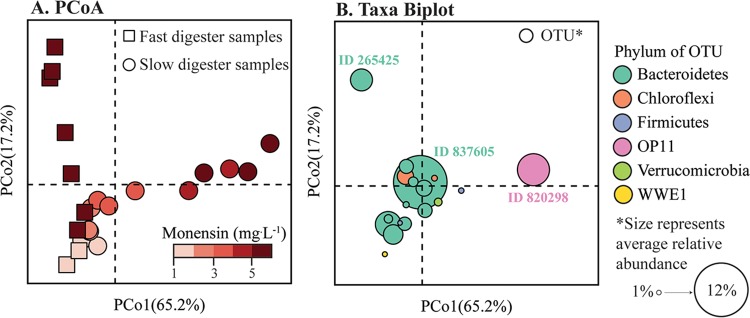
FIG 5.
β-Diversity of the fast and slow anaerobic digester microbiome samples during high monensin periods (≥1 mg · liter−1; day 265 to 307 for fast anaerobic digester, and day 307 to 383 for slow anaerobic digester). (A) Principal-coordinate analysis (PCoA) based on weighted UniFrac distance. Time points are colored in a gradient scale corresponding to monensin concentration in the substrate, as indicated by the color sidebar. (B) Taxon biplot showing the most abundant OTUs in these samples (OTUs that reached an average relative abundance of ≥1% across the time period shown). OTUs are shown nearest to the samples that they are most abundant in. Sample time points are not shown as they are displayed in the left-hand PCoA. Point size represents average relative abundance of that OTU across all samples (minimum average relative abundance is 1.0%, maximum average relative abundance is 12.0%). Points are colored by phylum-level taxonomy. Three OTUs discussed in the text are highlighted. OTU 820298, OP11 OTU; OTU 265425, Prevotella OTU; OTU 837605, Bacteroidales OTU.

