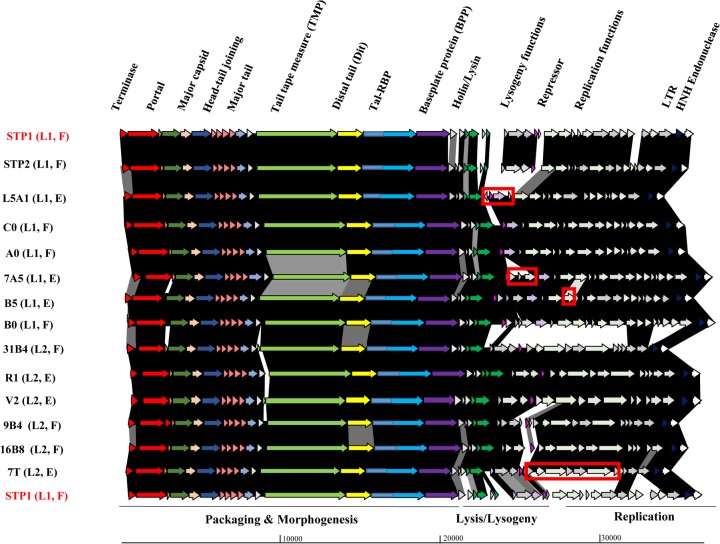
FIG 2.
Schematic representation of the genomes of lineage 1 (STP1, STP2, C0, A0, 7A5, B5, B0, and L5A1) and lineage 2 (7T, 9B4, 31B4, 16B8, R1, and V2) phages. Arrows (indicating protein-encoding regions) joined by shaded boxes indicate genetic regions of similarity, with the black shading indicating 90 to 100%, dark gray indicating 80 to 89%, light gray indicating 50 to 79%, and off-white indicating 30 to 49% aa identity. Arrows of the same color represent genes with a similar function. Gray arrows are indicative of genes encoding proteins of unknown function. The predicted functions of the encoded proteins are presented above the relevant arrows, where known and the functional modules are presented below the schematic. The major region of divergence between 7T (the first lineage 2 isolate) and STP1 (first lineage 1 isolate) is highlighted in the 7T genome representation by a red box. Similarly, regions of genetic novelty associated with isolates B5, 7A5, and L5A1 are highlighted in red boxes. All lineage 2 phage genomes possess a genomic region with greater than 90% identity. The lineage (L1/2) and source (F, factory; E, external) are also presented on the left side of the figure. LTR, long terminal repeat.

