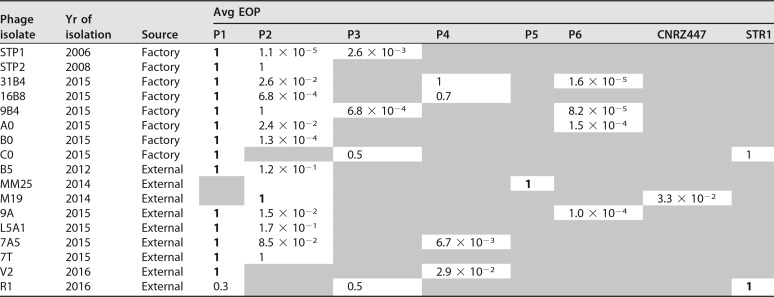
TABLE 2.
Host range highlighting the average EOP of phage isolates relative to the primary host and details of the origin of the isolatesa
The host range of each of the phages was assessed against a panel of 52 S. thermophilus strains. Only those strains that were sensitive to infection by one or more of the phages are presented in the table. Shaded areas indicate strains that were insensitive to infection by the isolated phages. Primary hosts are in bold.

