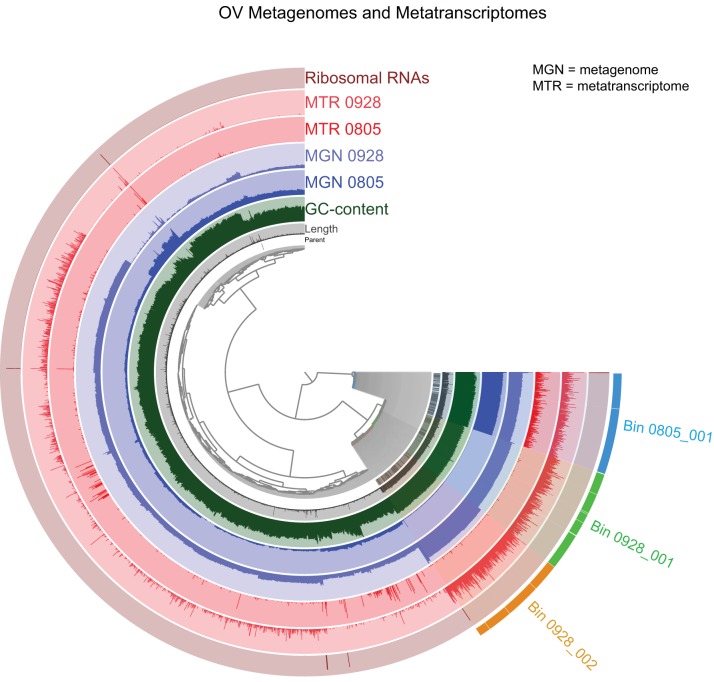
FIG 5.
Distribution and coverage of reads from each metagenome and metatranscriptome mapped onto the metagenome coassembly, visualized in anvi'o. Each branch of the dendrogram represents a contig or a contig split, with splits from the same contig denoted by the “parent” layer. Branches are clustered by k-mer composition and contig, or split, with length being represented in the “length” layer. GC content as a percentage is provided in the third layer. The two blue layers represent the two metagenome samples, while the two red layers represent the metatranscriptomes. The presence of rRNAs is shown in the outer layer. The coverage for each sample is shown in its respective circle. The three alphaproteobacterial MAGs used for phylogenetic analysis and transcriptome comparisons are shown in different colors on the bottom right part of the dendrogram.

