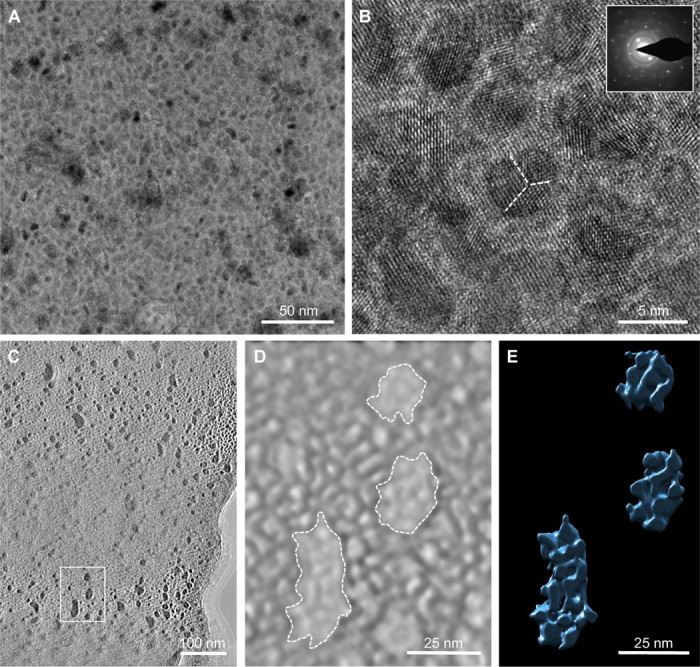
Fig. 3. Electron microscopy of a nanodomain substructure in the PL.

(A) Bright-field unstained TEM image of chicken eggshell after FIB sectioning of the PL showing mineral nanodomains with a diameter of 5 to 7 nm. (B) HRTEM lattice imaging of the nanodomains, with SAED (inset) showing both a single-crystal diffraction spot pattern and polycrystalline-derived diffraction rings. Evidence for further mineral suborientations within the nanodomains is indicated by the dashed lines. Contrast differences in (A) and (B) presumably result from the relative distributions of a mixture of organic and inorganic (amorphous and crystalline) components. (C) Single bright-field TEM image from a tilt series of the nanodomains in the PL. (D and E) 3D tomographic reconstructions of the same nanodomain region indicated by a box in (C) [solid rendering in (D) and surface rendering in (E)]. The surface rendering in (E) used a threshold that shows only the high-density regions indicated by the dashed lines in (D).
