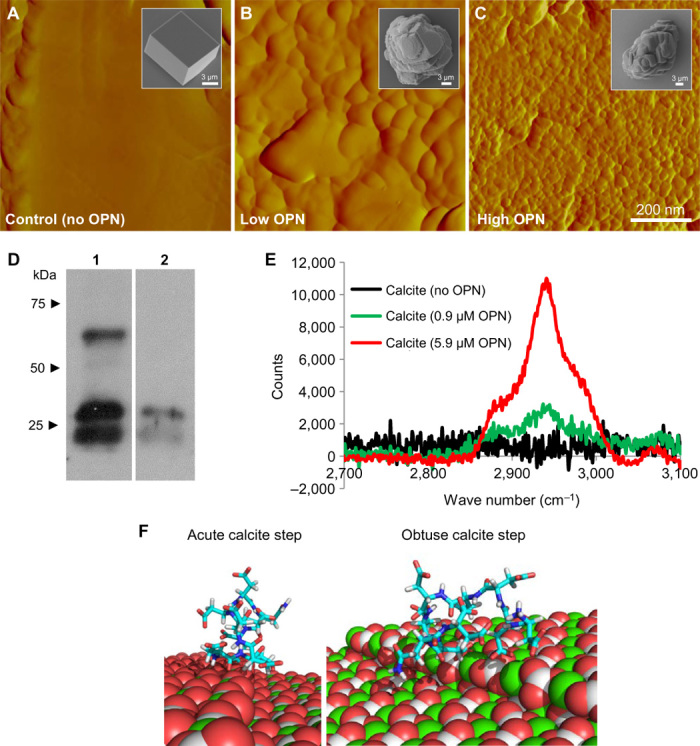
Fig. 5. Nanostructure induced by OPN and protein occlusion within calcite.

(A to C) AFM images of the interior of microtome-cut calcite crystals showing no nanostructure in the absence of OPN (A) but visible nanostructure after growth in the presence of 0.9 μM OPN (B) or 5.9 μM OPN (C) (scanning area, 800 nm × 800 nm). Insets in (A) to (C) show typical SEM images of calcite crystals from which AFM images were obtained after microtoming to expose the interior structure. (D) Immunoblotting after gel electrophoresis of dissolved crystals showing retrieved OPN and degraded OPN fragments (lane 1, OPN protein alone; lane 2, dissolved crystals growing in the presence of 5.9 μM). (E) Micro-Raman spectra from grown crystals, demonstrating a C–H protein peak. (F) Computationally simulated (RosettaSurface) conformer docking of the polyaspartate domain (99DDDDDDDND107) of chicken OPN on the obtuse and acute step of calcite (binding energy, approximately −14 kcal/mol for both cases). Calcite atoms: Ca, green; C, gray/white; O, red.
