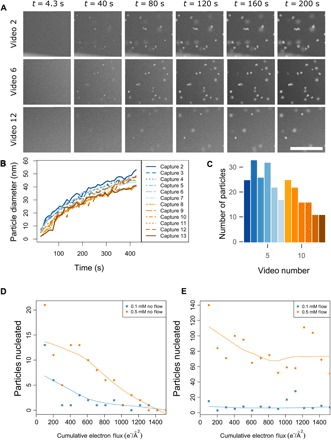
Fig. 2. Cumulative electron flux effects on silver nanoparticle growth.

(A) Individual frames showing growth of silver nanoparticles by reducing a 0.1 mM AgNO3 aqueous precursor solution with the electron beam. LC-STEM frames taken from video captures 2, 6, and 12 are compared across time. The scan area was 1024 × 1024 pixels, the dwell time was 3 μs, the beam current was 5.85 pA, and the pixel size was 1.47 nm, resulting in an electron flux of 0.51 e−/Å2 per scan. (B) Diameter of particles from all videos plotted over the course of the 200 scan exposures. Only particles in focus, contained entirely within the viewing area, and nonoverlapping are used in the growth rate analysis. (C) Total number of particles nucleated in each capture video, where particles on both windows (in focus and out of focus) are counted. (D) Number of particles nucleated for a 0.1 mM AgNO3 precursor solution (blue squares) and a 0.5 mM AgNO3 precursor solution (orange circles) without flow of fresh precursor during imaging. Each experiment was performed in an adjacent window for 200 STEM scans. The electron flux was 0.51 e−/Å2 per scan and 101.4 e−/Å2 per video. (E) Number of particles nucleated for a 0.1 mM AgNO3 precursor solution (blue squares) and a 0.5 mM AgNO3 precursor solution (orange circles) while flowing fresh precursor solution at a rate of 0.5 μl/min. The electron flux is equivalent to that in (D). Scale bar, 1 μm (A).
