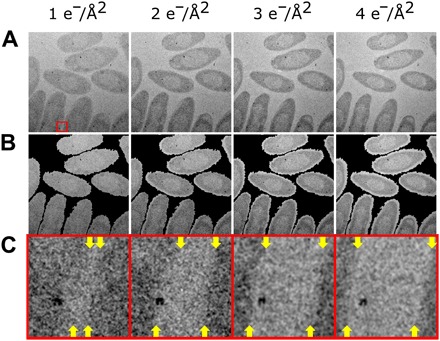
Fig. 4. Cumulative electron flux effects on biological cells.

(A) Damage series of C. metallidurans, imaged using a low-dose imaging regime at an electron flux of 1 e−/Å2 per acquisition. Time between each subsequent acquisition was 20 min, where the beam was blanked during that time. Flux labeled is total cumulative flux for the frame. Total field of view, 3.5 μm × 3.5 μm. (B) Overlay of cell boundary from initial image (A) (1 e−/Å2) highlighting decreasing size and morphological changes of cells as a function of increasing cumulative electron flux. (C) Magnification (×10) of region depicted in (A), where the edge of the cells (yellow arrows at top and bottom of each frame) can be seen moving relative to the metal cluster with increasing electron flux.
