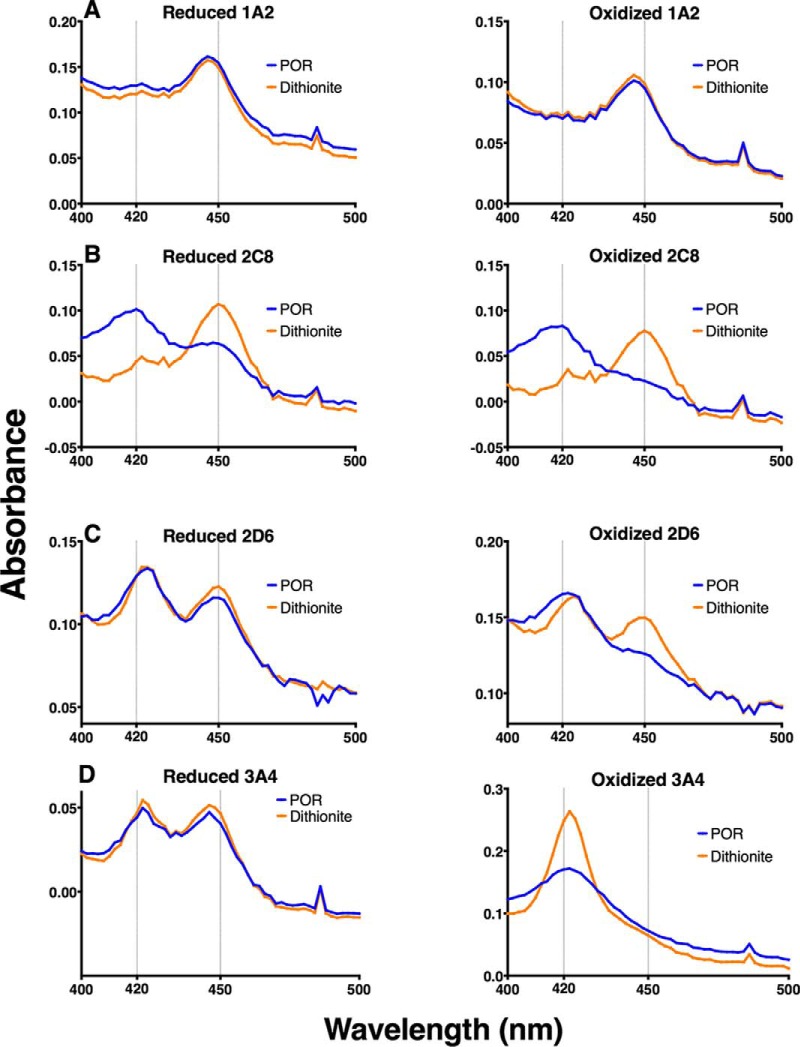
Fig. 2.
Spectral analysis of oxidized P450s. TCEP-pretreated P450s were treated with 500 μm H2O2 and (after the removal of residual H2O2 by catalase) reconstituted with NADPH-P450 reductase, deaerated, and placed under an anaerobic atmosphere of CO. Following the addition of NADPH, spectra were recorded for the TCEP-reduced (Fig. 2A) and H2O2-oxidized (Fig. 2B) samples (NADPH-P450 reductase (POR), blue traces). Following NADPH addition, sodium dithionite (Na2S2O4) was added as a stronger reducing agent (dithionite, orange traces). Analysis was performed for P450s 1A2 (A), 2C8 (B), 2D6 (C), and 3A4 (D).

