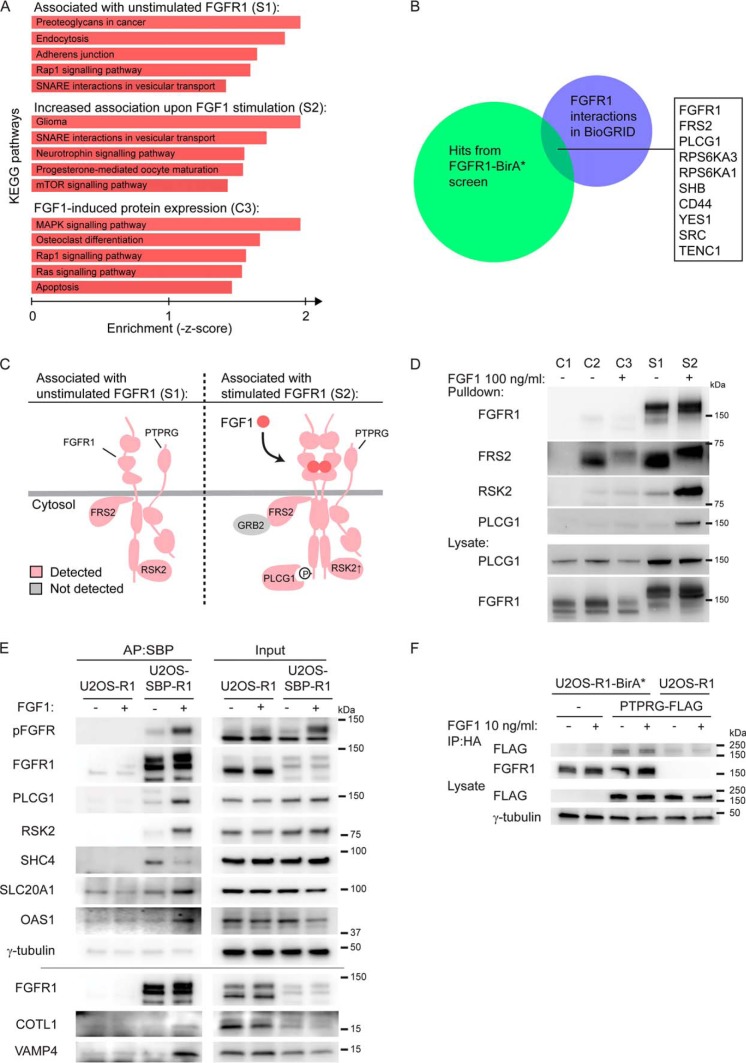
Fig. 2.
Analysis and validation of the proteomic screen A, KEGG pathways analyses were applied to the three datasets using Enrichr (http://amp. pharm.mssm.edu/Enrichr/) (30). B, A comparison of proteins identified in S1 and S2 with published interactions for FGFR1 denoted in BioGRID (35). C, Schematic illustration of selected proteins identified in the absence of FGF1 (S1) and in the presence of FGF1 stimulation (S2). Identified proteins are colored pink and some known proteins not detected are in gray. The enrichment of proteins in FGF1-stimulated cells versus unstimulated cells; PLCG1: 12.4X, RSK2: 4.0X, FGFR1: 1.0X, FRS2: 0.7X, PTPRG: 0.6X. D, U2OS-R1 control cells (C1), U2OS-R1 cells coexpressing BirA* (C2-C3), U2OS-R1-BirA* cells (S1-S2) were treated with biotin in the presence or absence of FGF1 for 24 h. The cells were then lysed and the biotinylated proteins were isolated by Streptavidin pulldown and analyzed by SDS-PAGE and Western blotting using the indicated antibodies. One representative of two independent experiment is shown. E, Validation of identified interactors by affinity purification (AP). U2OS-R1 and U2OS-SBP-R1 were starved for 2 h before addition of 10 ng/ml FGF1 in the presence of 20 U/ml heparin for 15 min, and then the cells were lysed. Proteins bound to SBP-FGFR1 were affinity-purified using streptavidin Sepharose and analyzed by Western blotting. One experiment of two is presented. F, U2OS-R1-BirA* and U2OS-R1 cells were transfected with PTPRG-MYC-FLAG plasmid for 24 h. U2OS-R1-BirA* cells not transfected with PTPRG were included as a control. Cells were then starved for 2 h and left untreated or treated with 10 ng/ml FGF1 in the presence of 20 U/ml heparin for 15 min. After that, the cells were lysed and the lysates were subjected to immunoprecipitation using anti-HA magnetic beads followed by SDS-PAGE and Western blotting with indicated antibodies. R1-BirA* is fused to an HA-tag in the C-terminal end.

