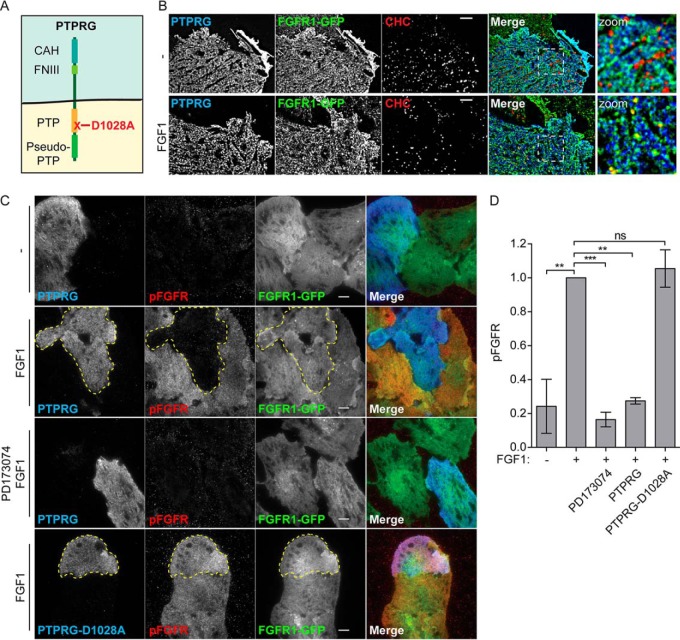
Fig. 4.
PTPRG counters FGFR1 autophosphorylation A, Schematic presentation of PTPRG. PTPRG is a transmembrane protein with an extracellular carbonic anhydrase-like domain (CAH) and a fibronectin type III-like domain (FNIII). The intracellular part contains two protein tyrosine phosphatase domains (PTP) of which only one is active (indicated in orange). The other is called a pseudo-PTP. Mutation of aspartic acid 1028 to alanine inactivates the phosphatase activity. B, U2OS-R1-GFP cells transfected with PTPRG-myc-FLAG (for 20 h), serum starved for 2 h, and unstimulated (-) or stimulated with FGF1 for 15 min (FGF1), were fixed and stained with anti-myc and anti-Clathrin heavy chain, and imaged by TIRF. Merged images are overlays of PTPRG in blue, FGFR-GFP in green, and Clathrin in red. Blue and green overlay appears cyan. Green and red overlay appears yellow. Images were deconvolved, scale bar 4 μm. C, U2OS-R1-GFP cells were transfected with MYC-FLAG-tagged PTPRG or PTPRG-D1028A (for 20 h), starved for 2 h, and stimulated (or not) with FGF1 in the presence of heparin for 10 min (in one case in the presence of FGFR1 tyrosine kinase inhibitor PD173074) and then fixed and stained with anti-FLAG, anti-pFGFR1 (Y653/Y654), and fluorophore labeled secondary antibodies. The cells were imaged by TIRF. Merged images are overlays of PTPRG in blue, pFGFR1 in red, and FGFR1-GFP in green. Stippled lines indicate cells transfected with PTPRG or PTPRG-D1028A. Scale bars 8 μm. D, The signal intensities for pFGFR1 in PTPRG-transfected or -untransfected cells were measured for 15–30 cells for each condition in three independent experiments and is presented as the mean values ± S.D. where values had been normalized to the signal intensity of untransfected cells stimulated with FGF1. The data were analyzed using one-way RM ANOVA followed by Tukey post hoc test. ***p ≤ 0.001, **p ≤ 0.01, ns - not-significant.

