Fig. 7.
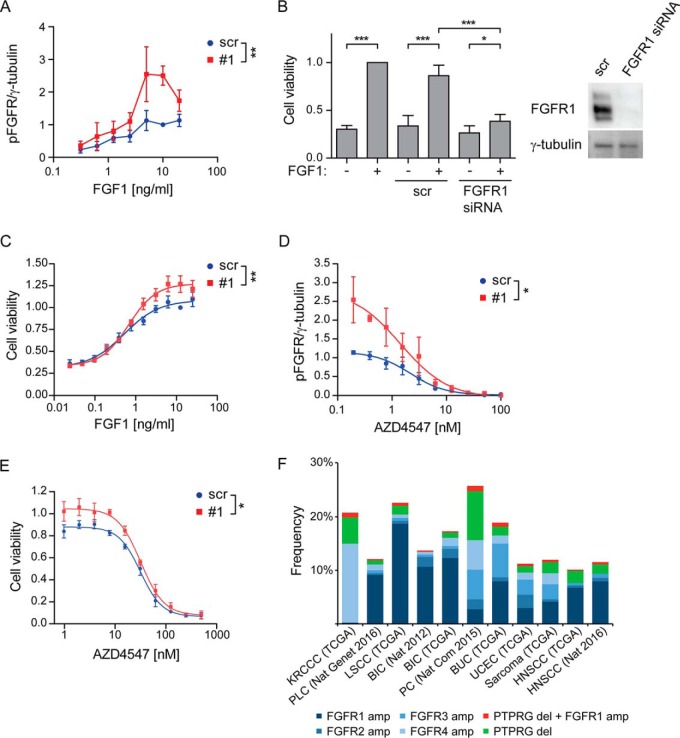
PTPRG regulates cellular sensitivity to FGF1. A, U2OS-R1 cells were treated with siRNAs against PTPRG (#1) or control siRNA (scr) for 72 h. Then the cells were serum-starved for 2 h and stimulated with various concentrations of FGF1 in the presence of 10 U/ml heparin for 15 min and lysed. The lysates were subjected to SDS-PAGE followed by Western blotting using denoted antibodies (supplemental Fig. S5A). Western blots were quantified and bands corresponding to phosphorylated FGFR1 (pFGFR) were normalized to loading control (γ-tubulin) and presented as fraction of scr, 10 ng/ml stimulation. The graph represents the mean ± S.E. of three independent experiments. The concentration series were analyzed together using two-way ANOVA. **p ≤ 0.01. B, G292 cells were left untreated or treated with FGFR1 siRNA or control siRNA (scr) for 72 h. During the last 48 h the cells were treated with 100 ng/ml FGF1 in the presence of 10 U/ml heparin. Cell viability was then measured using CellTiter-Glo assay. The obtained data were normalized to nontransfected cells, stimulated with FGF1. The graph represents the mean ± S.D. of four independent experiments. ***p ≤ 0.001, *p ≤ 0.05. A Western blot showing the knockdown efficiency of FGFR1 after 72 h are presented to the right. C, G292 cells were treated with PTPRG siRNA (#1) or control siRNA (scr) for 72 h and then stimulated with different concentrations of FGF1 in the presence of 10 U/ml heparin for 48 h. Cell viability was then measured using CellTiter-Glo assay. The obtained data were normalized to scr, 12.5 ng/ml FGF1 and presented in the graph as means ± S.E. of 4 independent experiments. The fitted curve represents nonlinear regression analysis using Hill equation (dose-response with variable slope). The concentration series were analyzed together using two-way ANOVA. **p ≤ 0.01. D, U2OS-R1 cells were treated with siRNAs against PTPRG (#1) or control siRNA (scr) for 72 h, serum-starved for 2 h and stimulated with 10 ng/ml FGF1 in the presence of 10 U/ml heparin and various concentrations of AZD4547 for 15 min. The cells were then lysed and the lysates were subjected to SDS-PAGE followed by Western blotting using denoted antibodies (supplemental Fig. S5B). Western blots were quantified and bands corresponding to phosphorylated FGFR1 (pFGFR) were normalized to loading control (γ-tubulin) and presented as fraction of scr, 10 ng/ml stimulation. The graph represents the mean ± S.E. of three independent experiments. The fitted curve represents nonlinear regression analysis using Hill equation (dose-response with variable slope). The inhibitor concentration series were analyzed together using two-way ANOVA. *p ≤ 0.05. E, G292 cells were treated with PTPRG siRNA (#1) or control siRNA (scr) for 72 h and then stimulated with 10 ng/ml FGF1 in the presence of 10 U/ml heparin and various concentrations of AZD4547 for 48 h. Cell viability was then measured using CellTiter-Glo assay. The obtained data were normalized to scr without inhibitors and presented in the graph as means ± S.E. of three independent experiments. The fitted curve represents nonlinear regression analysis using Hill equation (dose-response with variable slope). The inhibitor concentration series were analyzed together using two-way ANOVA. *p ≤ 0.05. F, The graph shows the frequency of amplifications of the different FGFRs, deletions of PTPRG and the frequency of cases where at least one receptor is amplified and PTPRG is deleted. The figure is based on data generated by the TCGA Research Network (http://cancergenome.nih.gov/). The frequency is calculated according to the total number of cases for each study: KRCCC (Kidney Renal Clear Cell Carcinoma, 448 cases), PLC (Pan-Lung Cancer, 1144 cases), LSCC (Lung Squamous Cell Carcinoma), BIC (Breast Invasive Carcinoma, 482 cases and 1105 cases), PC (Pancreatic Cancer, 109 cases), BUC (Bladder Urothelial Carcinoma, 127 cases), UCEC (Uterine Corpus Endometrial Carcinoma, 242 cases), Sarcoma (243 cases), HNSCC (Head and Neck Squamous Cell Carcinoma, 504 and 279 cases).

