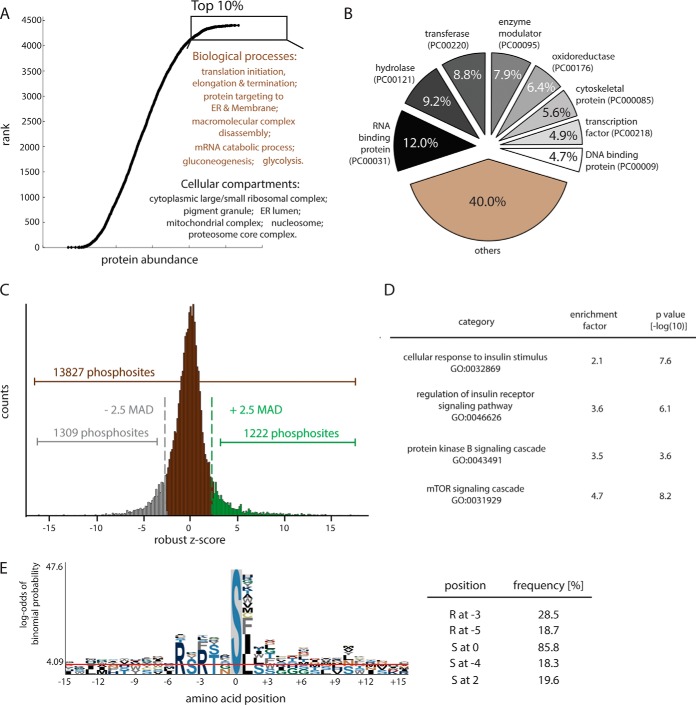
Fig. 3.
Analysis of the HepG2 phosphoproteome. A, Ranked abundance atlas of HepG2 hepatocyte proteins. GO enrichment analysis was performed by Fisher exact test with a threshold of Benjamini-Hochberg FDR 1%. B, Proteins in HepG2 proteome categorized by PANTHER classification system. C, Distribution of quantified phosphosites (Student's t test, p < 0.05). Applying a threshold of 2.5-median absolute deviations (MAD) to the log2-transformed data revealed 1222 positively regulated and 1309 negatively regulated phosphosites. D, Enrichment analysis of proteins with phosphosites up-regulated by insulin. E, Motif analysis for insulin up-regulation phosphosites reveals high representation of an Akt consensus site.

