Fig. 6.
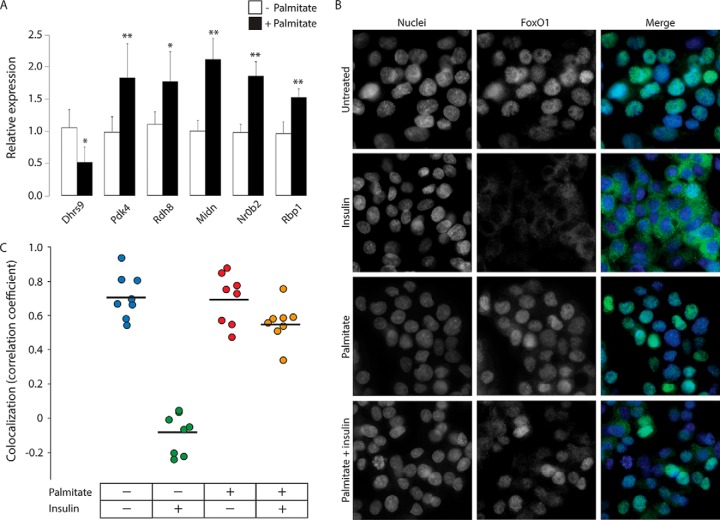
FoxO1 localizes to nuclei of HepG2 cells during palmitate treatment. A, Relative mRNA expression levels of FoxO1 target genes in HepG2 cells following 24 h palmitate treatment. Statistical significance was determined by Mann-Whitney test (* p < 0.05 and ** p < 0.005, n = 6). B, Immunocytochemistry analyses of FoxO1 localization in 24-h palmitate- and/or 2-h insulin-treated HepG2 cells. Green: FoxO1; Blue: DAPI. C, Pearson's correlation coefficient of colocalization analyses between green-FoxO1 and blue-DAPI immunostainings (n = 8).

