
Fig. 2.
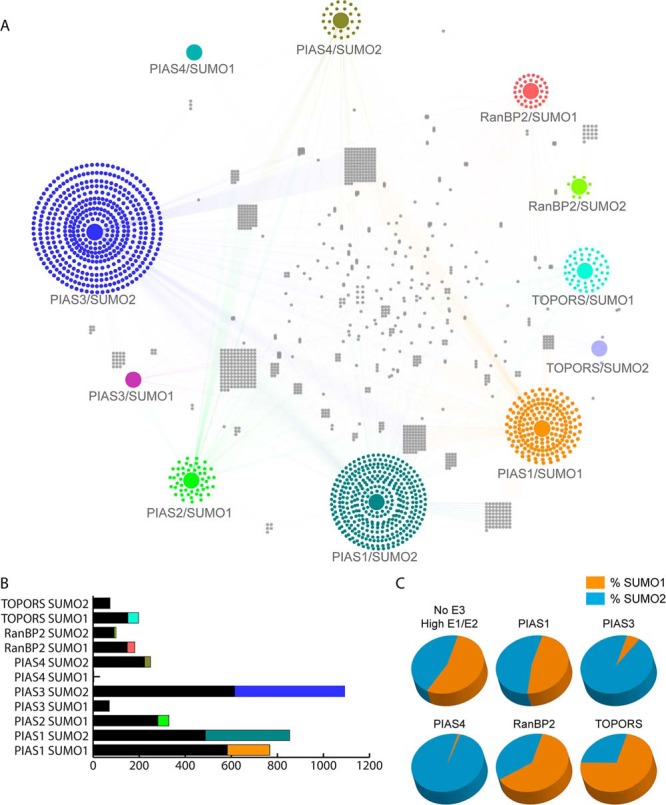
Specificity in E3 ligase mediated-SUMOylation. A, A network showing the connections between each E3 ligase/SUMO isoform pairing and the modified substrates was generated using Cytoscape. The colored edges depict the connection to an upstream E3 ligase. Many substrates are connected to more than one E3 ligase/SUMO pairing, thus revealing the overlap and redundancy between E3 ligases. B, The proportions of substrates shared by E3 ligases as compared with the unique substrates targeted by each E3 ligase/SUMO pairing. The colored fractions represent the number of substrates unique to the reaction, whereas the black fractions represent the targets modified in at least two reactions. C, Preferential modification with SUMO1 versus SUMO2. The orange fraction represents the percentage of total hits modified with SUMO1; the blue fraction represents substrates modified with SUMO2. Substrates modified with SUMO1 and SUMO2 are counted in both fractions.