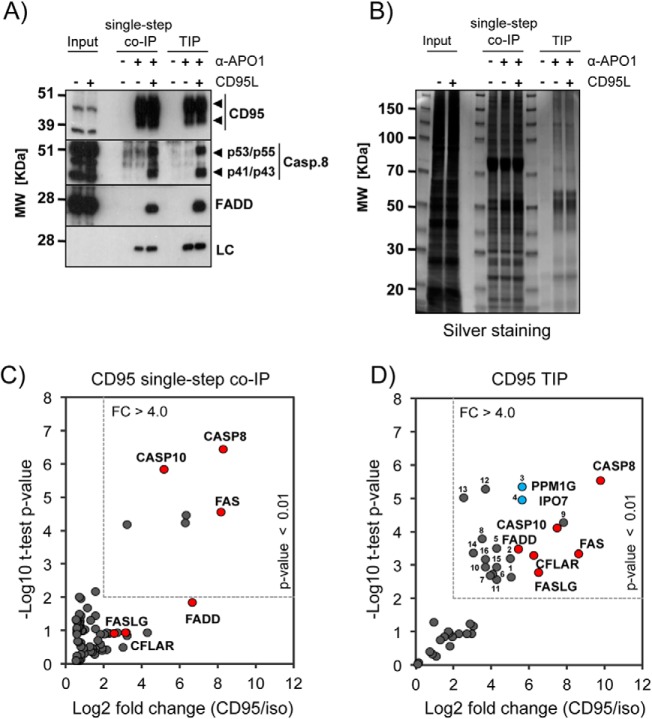
Fig. 2.
Comparison of Single-Step co-IP and TIP. A, Representative Western blotting for the CD95/FAS-complex isolations: 1 × 10⁷ BJAB cells were used to perform single-step co-IP and TIP from untreated (−) and CD95L stimulated (+) cells (LC: biotinylated mouse IgG light chain; arrowheads: specific signals). B, Silver staining of a representative SDS-PAGE for the CD95/FAS isolations described above. C, Scatter plot showing the enrichment analysis for CD95/FAS single-step co-IP versus the isotype control samples (three replicates each). The dotted square indicates the cutoff used to define significant enrichment that was set to a p value <0.01 (student t test) and a fold change (FC) >4-fold. Known interacting proteins are colored in red and labeled with their gene name. For the full analysis see supplemental Tables S1 and S2A. D, Scatter plot showing the enrichment analysis for CD95/FAS-TIP versus the isotype control samples (three replicates each). The cutoff for significant enrichment was defined as in (C). For the detailed analysis see supplemental Tables S1 and S2B. Known interacting proteins are colored in red and labeled with their gene name; the blue dots represent PPM1G and IPO7; the identified proteins are numbered and described in supplemental Table S2C.

