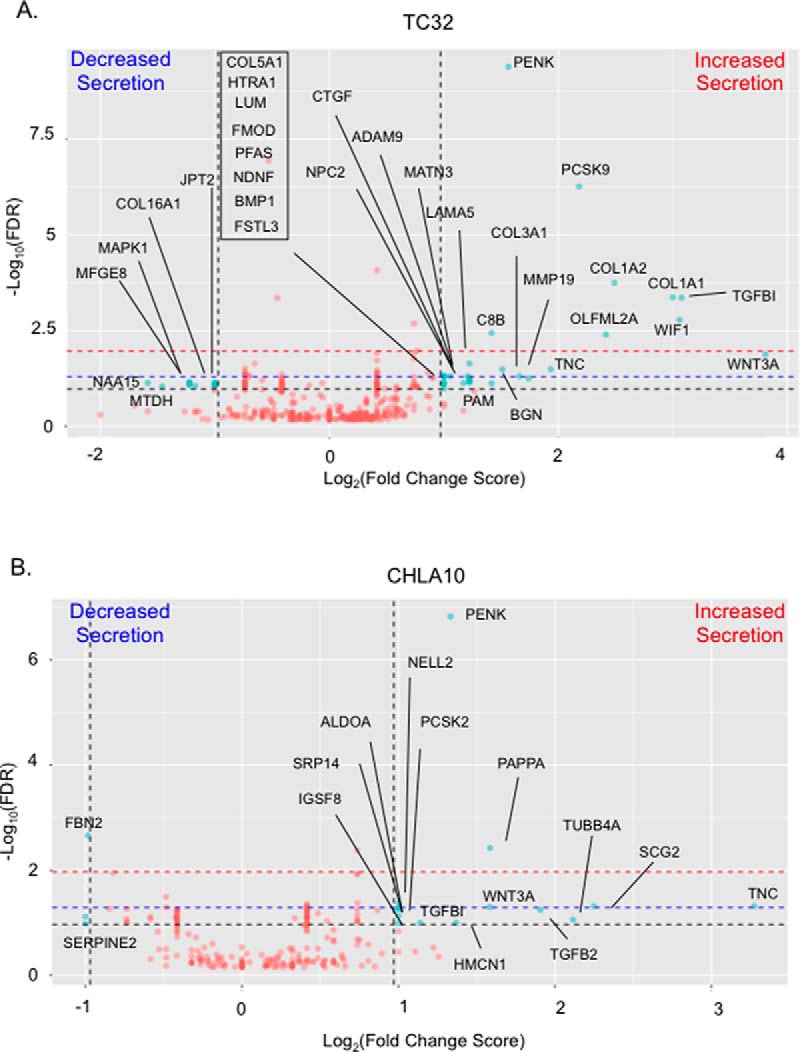
Fig. 4.

Stimulation with Wnt3a changes the Ewing sarcoma secretome. Volcano plots showing the Log2(Fold Change Score) versus -Log10(localFDR). Red dots indicate proteins that were not differentially secreted and blue dots indicate proteins that were considered to be differentially secreted. Proteins that were considered differentially secreted have Fold Change Score >2 or <.5 and QPROT computed local FDR of differential expression <.1 (indicated by the black dashed lines). We also have noted that FDR <.05 results in 16 differentially secreted proteins in TC32 and 5 in CHLA10 (proteins that are above the blue dashed line). An FDR <.01 results in 8 proteins in TC32 and 2 in CHLA10 to be differentially secreted (proteins that are above the red dashed line).
