
Fig. 2.
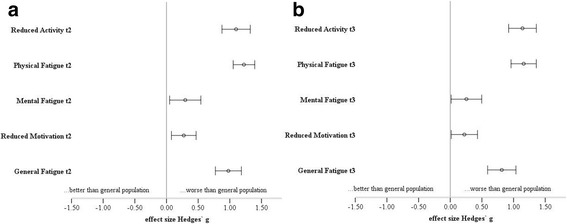
a, b Effect sizes with 95% CI comparing patients and the general population at t2 and t3. CI: confidence interval; German general population (N = 2037) according to Schwarz et al. [23]
Official websites use .gov
A
.gov website belongs to an official
government organization in the United States.
Secure .gov websites use HTTPS
A lock (
) or https:// means you've safely
connected to the .gov website. Share sensitive
information only on official, secure websites.
a, b Effect sizes with 95% CI comparing patients and the general population at t2 and t3. CI: confidence interval; German general population (N = 2037) according to Schwarz et al. [23]