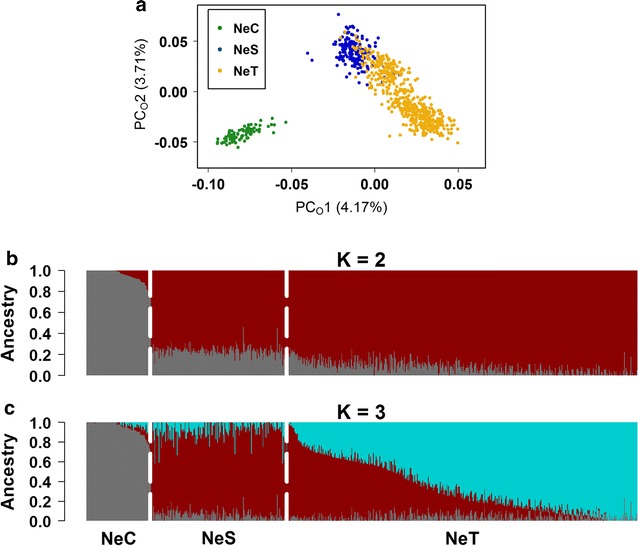
Fig. 2.

Population structure, as revealed by MDS and admixture analyses. a Depicts the distribution of samples based on the first two principal coordinates (PCo) provided by their genomic distance matrix. The variance explained by each PCo is indicated within brackets. b and c The results of admixture analyses with inferred numbers of clusters i.e. K = 2 (b) and K = 3 (c). White dashed lines separate the experimental lines. Each sample is represented by a vertical bar partitioned into stained segments according to its proportion of ancestry in each of the clusters
