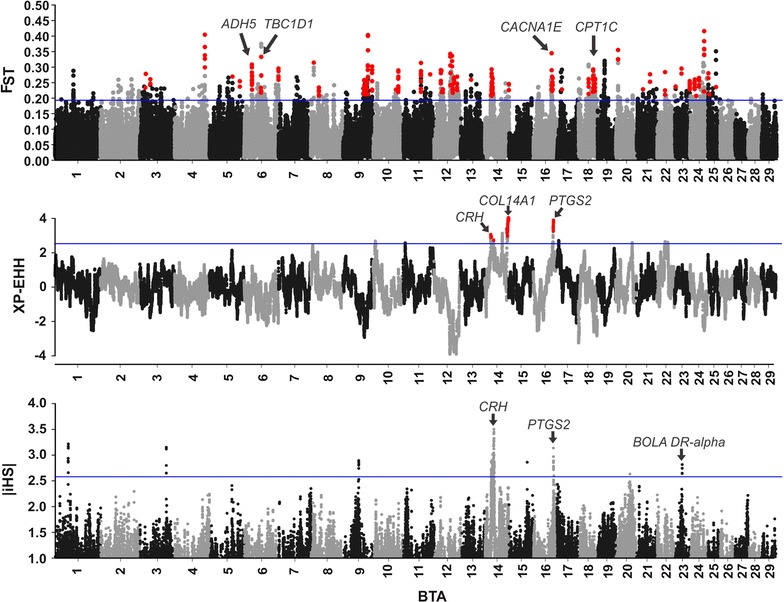
Fig. 3.

Genome-wide FST, XP-EHH and iHS scores averaged for 100-kb windows (75 kb overlapped). Blue lines indicate the significance threshold adopted for each test. The FST and XP-EHH values represent the means for the same windows in the “NeC vs. NeS” and “NeC vs. NeT” comparisons. Red dots represent windows that surpass the upper-cutoff windows in both comparisons, hence putative signatures of selection
