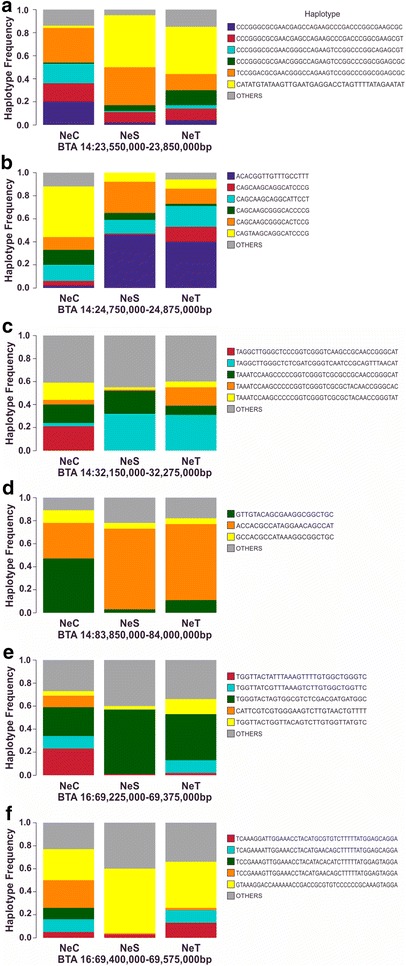
Fig. 4.

Haplotype frequencies for the four signatures of selection detected by two methods. Genomic regions were detected by both FST and iHS (a, b), XP-EHH and iHS (c, e, f) or both FST and XP-EHH (d). Different colors, except the grey color, refer to haplotypes with a frequency higher than 0.1 in at least one of the three lines
