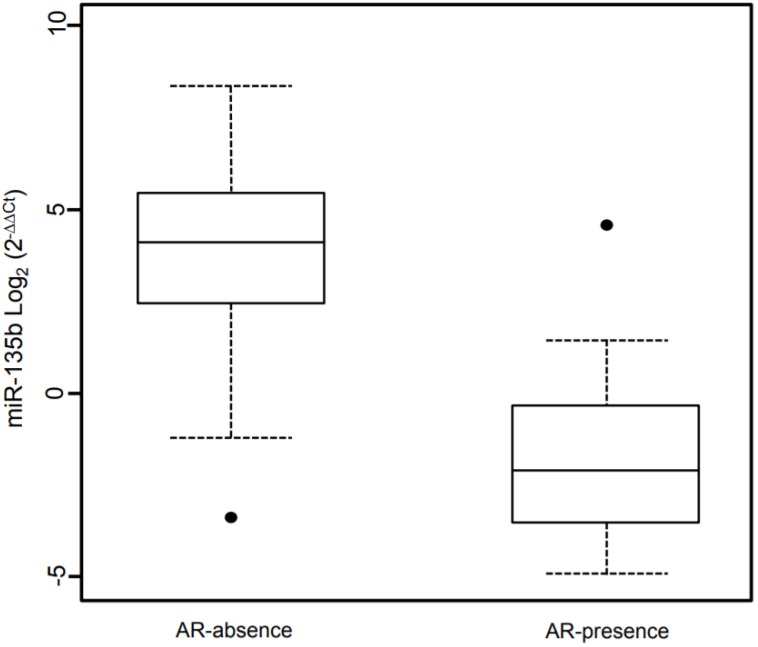
Figure 6.
Box plot showing the distribution of miR-135b expression levels associated with the presence/absence of Androgen Receptor status. Box plot explanation: upper horizontal line of box, 75th percentile; lower horizontal line of box, 25th percentile; horizontal bar within box, median; upper horizontal bar outside box, 90th percentile; lower horizontal bar outside box, 10th percentile. Dot represent outliers. The values of miR-135b expression levels are indicated in Log2 (2-ΔΔCt).

