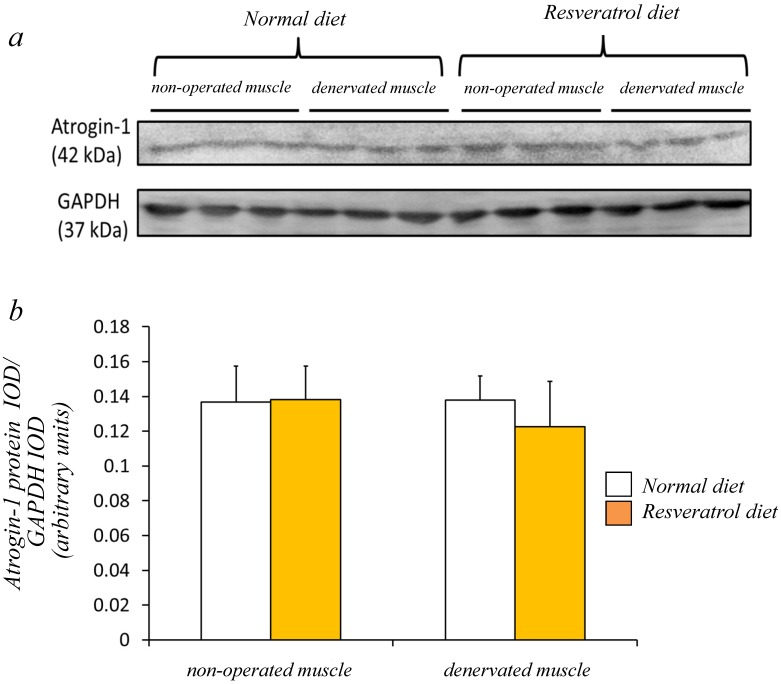
Figure 3.
Western blot analysis showed that the denervated muscles of both mice were not significantly increased in the atrogin-1 protein compared with those non-operated muscles (a). No significant difference in the amount of atrogin-1 protein was observed in the gastrocnemius muscles between normal and resveratrol fed mice (b). The integrated optical density (IOD) of atrogin-1 protein was normalized to the IOD of each internal control (GAPDH) (arbitrary units). Values are means ± SD (n=8/group).

