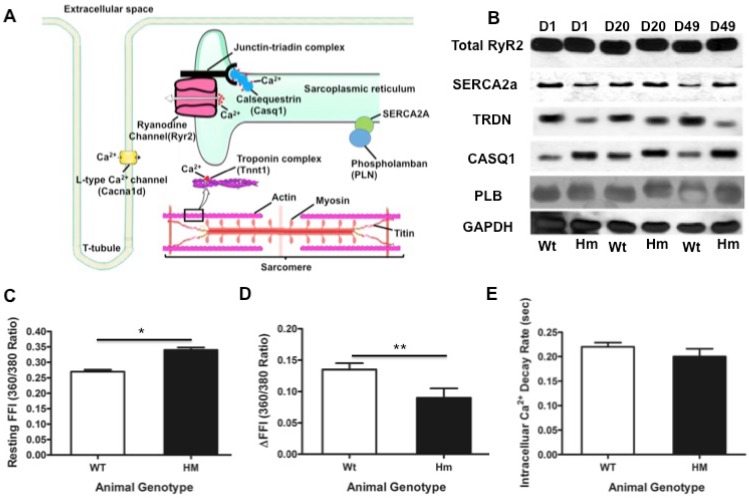
Figure 6.
Transcriptional network of calcium handling genes and intracellular calcium changes. (A), Schematic diagram of calcium release signaling and sarcomere; (B), validation of key calcium handling proteins with western blotting; (C), Intracellular calcium concentration changes with cardiomyocytes isolated from the rat heart at d49. Resting FFI, basal intracellular calcium level; (D), ΔFFI, Rise in intracellular calcium in response to electrical stimulus shown as changes in Fura-2 fluorescence intensity; (E), D, day; Wt, wild type; Hm, Rbm20 homozygous knockout; GAPDH, protein loading control. Mean ± SEM (n=30), *P < 0.05, **P<0.01.

