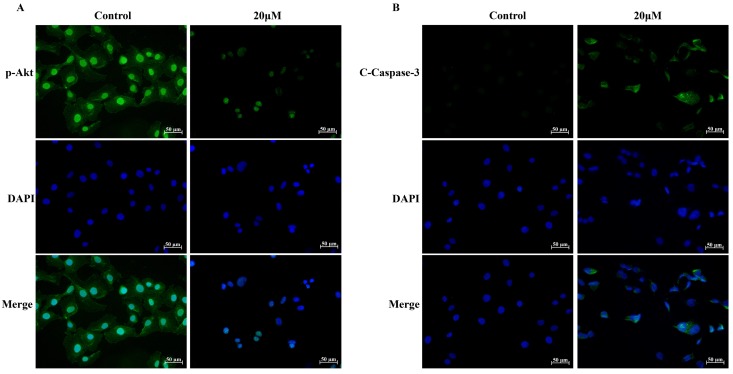
Figure 4.
Immunofluorescence analysis for p-Akt (Ser473) and Cleaved Caspase-3. (A) The expression and location of p-Akt (Ser473) in UMUC3 cells treated with 0 or 20 μM GLA were detected by immunofluorescence staining (green) whereas the nuclei were stained with DAPI (blue). (B) The expression and location of Cleaved Caspase-3 in UMUC3 cells treated with 0 or 20 μM GLA were confirmed by immunofluorescence staining (green) whereas the nuclei were stained with DAPI (blue). Scale bars = 50 μm.

