Fig. 4.

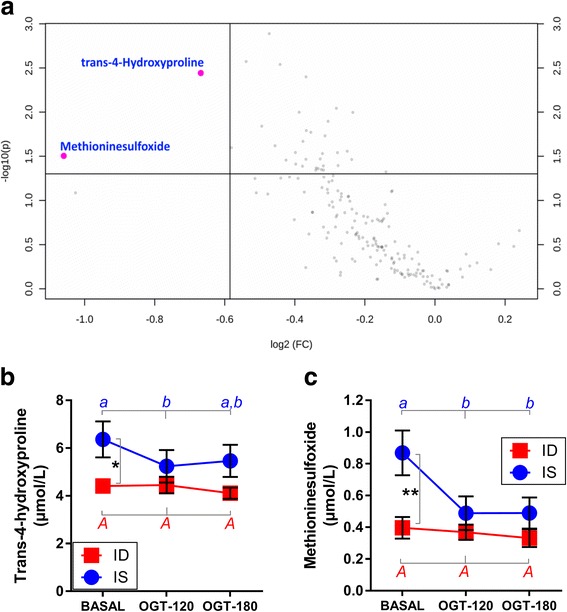
a Volcano plot highlighting metabolites of importance (trans-4-hydroxyproline p = 0.0036; methinonine sulfoxide p = 0.0134) which were different between insulin-sensitive (IS) and insulin-dysregulated (ID) horses under unchallenged conditions (only BASAL) (b) Trans-4-hydroxyproline (repeated measure two-way ANOVA (rmTWA), factor insulin sensitivity status p < 0.05, factor OGT p = 0.06) and (c) methionine sulfoxide (rmTWA, factor insulin sensitivity status p < 0.05, factor OGT p = 0.06) concentrations shown in serum of IS and ID horses at three levels of OGT: before glucose administration (BASAL), and 120 min (OGT-120) and 180 min (OGT-180) after administration (means ± SEM, n = 10). Significant differences between IS and ID are indicated as ** (p < 0.01), * (p < 0.05). a, b = different superscripts indicate significant differences (p < 0.05) between basal and challenged conditions in IS horses, while no OGT effect was observed (as indicated by A) in ID horses (Bonferroni post hoc test)
