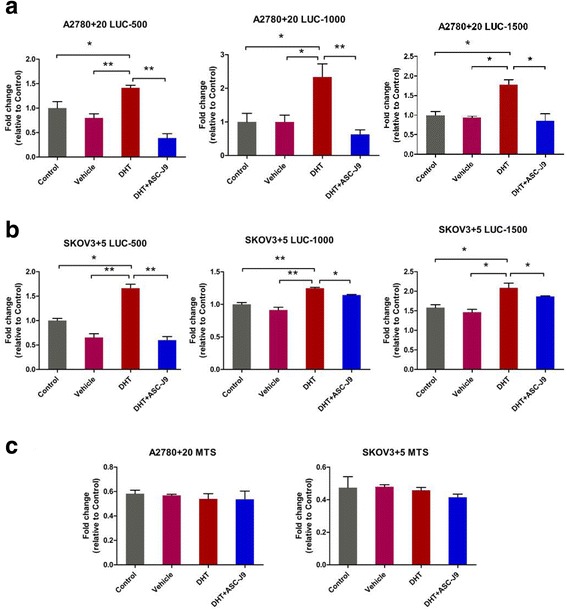
Fig. 4.

The AR signaling axis increases Nanog transcriptional activity. a and b) Promoter activities of different regions of the Nanog promoter, namely, TSS + 1~ − 500 bp, − 500~ − 1000 bp, and − 1000~ − 1500 bp, under androgen treatment in A2780 + 20 and SKOV3 + 5 cells determined using firefly luciferase reporter assays. c) Cell death and viability were tested with MTS assays. No differences were evident among the groups. Control: no treatment. Vehicle: DMSO; DHT: 10 nM; ASC-J9: 5 μM. *P < 0.05; **P < 0.01
