Fig. 2.

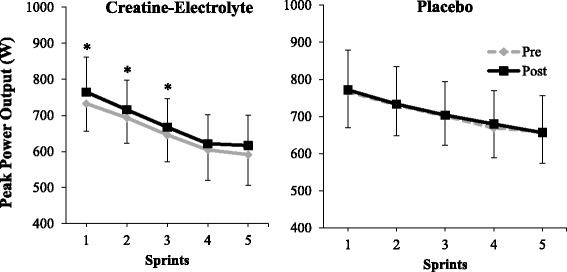
Peak power output (W) during each of the five 15-s sprints for the CE and P group, pre- and post-supplementation. * Indicates significant improvement in sprint performance from pre- to post-testing (p < 0.05)

Peak power output (W) during each of the five 15-s sprints for the CE and P group, pre- and post-supplementation. * Indicates significant improvement in sprint performance from pre- to post-testing (p < 0.05)